NCC:
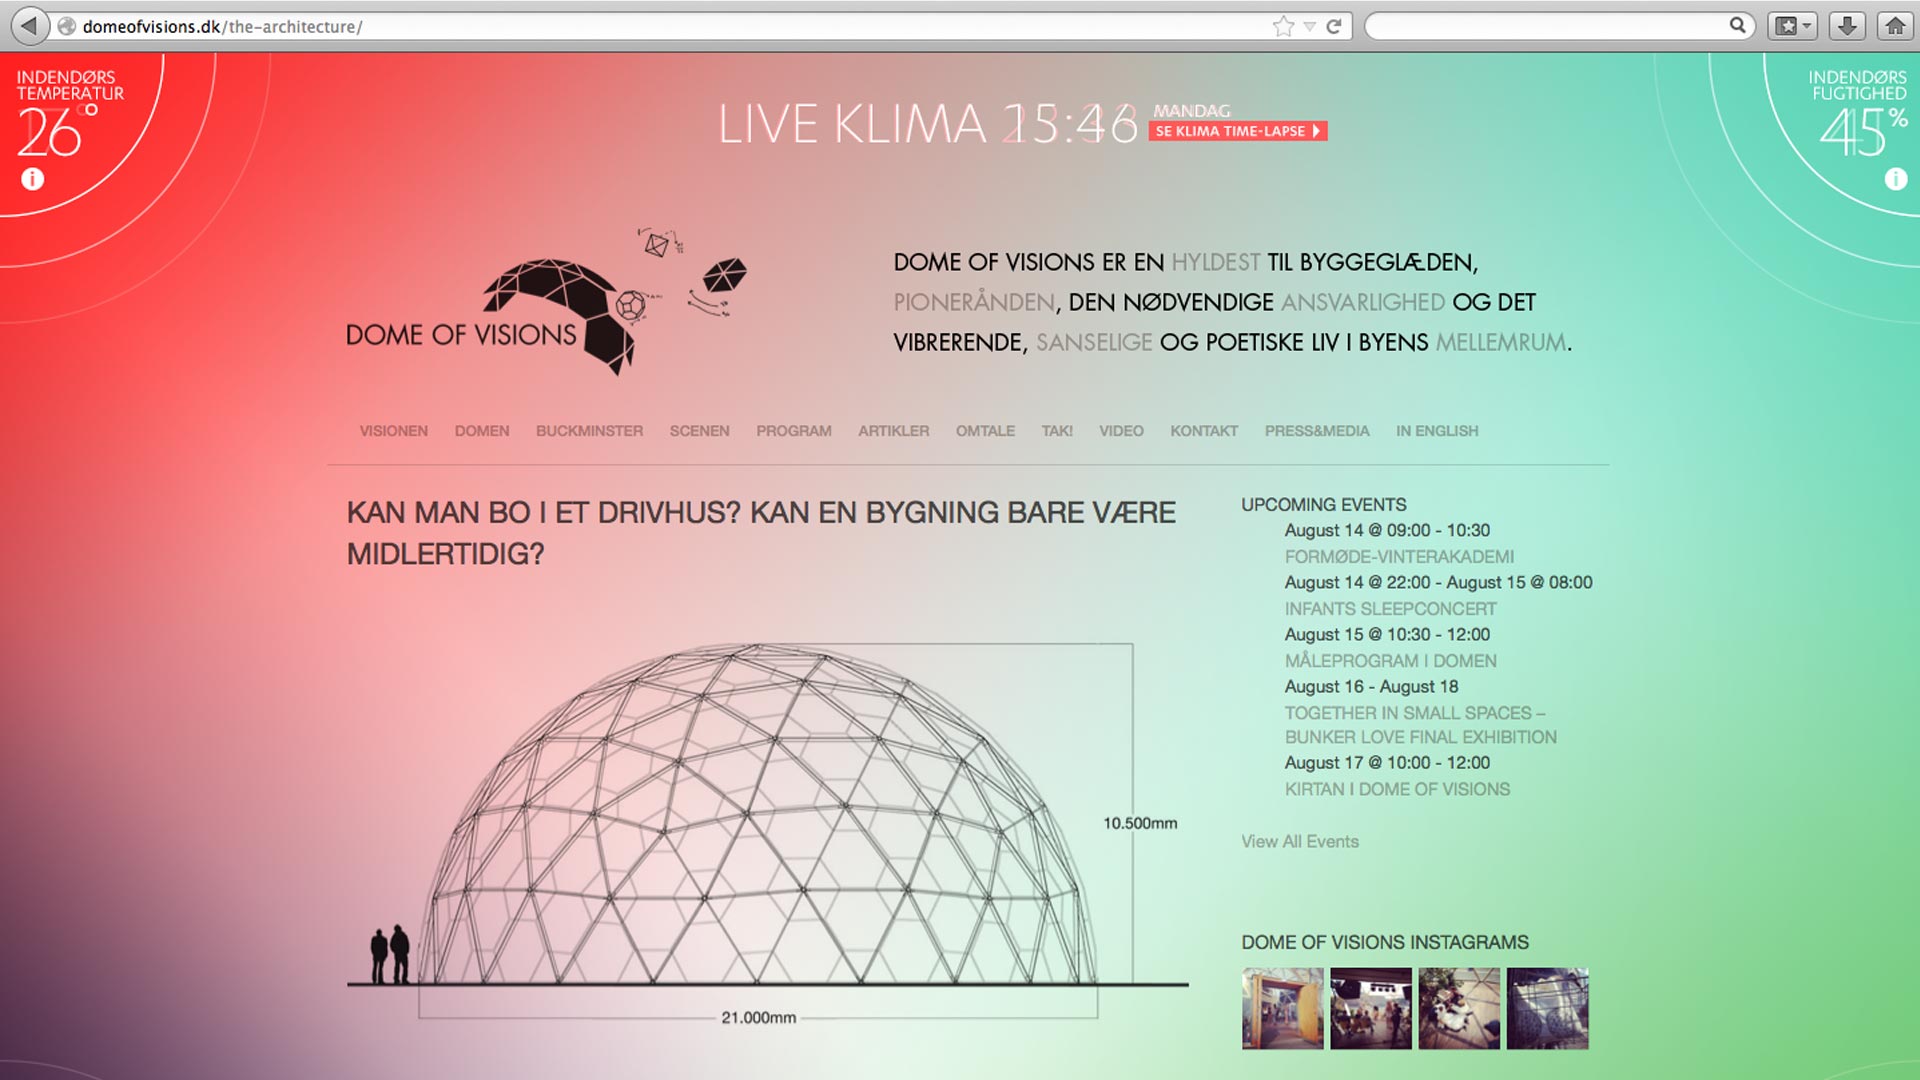
Dome of visions
Client: Dome of visions
Agency: Konstellation
Role: UX, Creative, Producer
Year: 2015
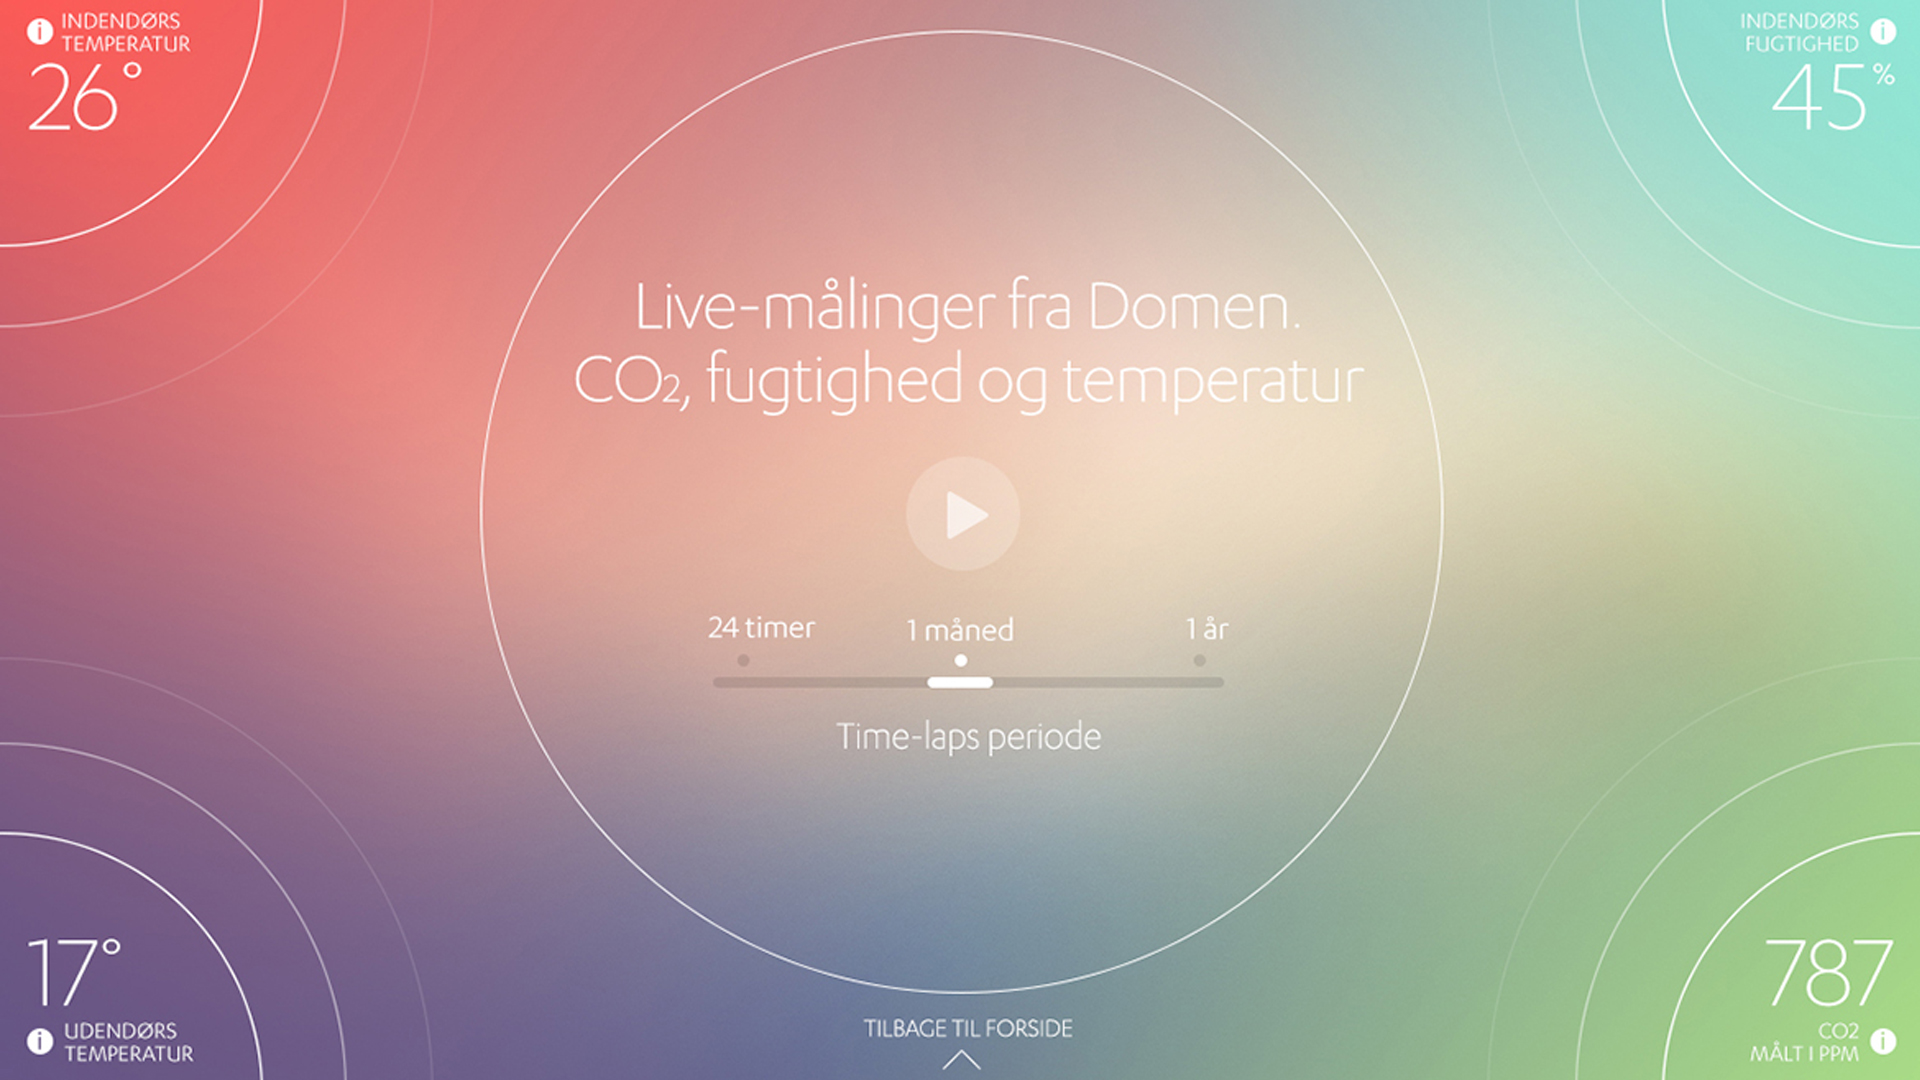
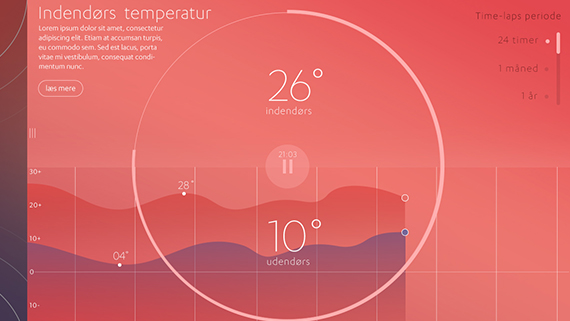
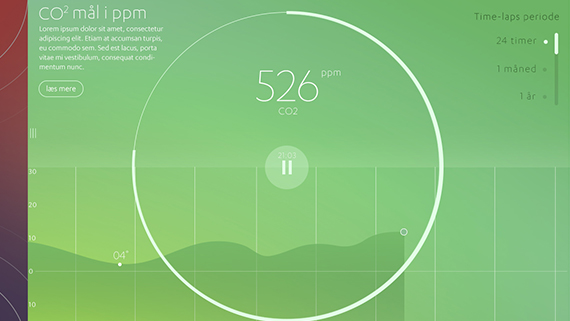
Live presentation of data: temperature, humidity and CO2 from Dome of visions was already available on the site ic-meter.com. This interface was created by and for developers and did not communicate or resonate with the end user. We needed to make a solution that would be more in tune with the target audience and communicate the importance of global warming.

The solution
Data, infographics and dashboards are more popular than ever….
”Data isn’t about graphics and visualizations.. it’s about telling a story”.
We wanted to take the experience one step further and make the experience relatable and visually appealing and tell a stor.
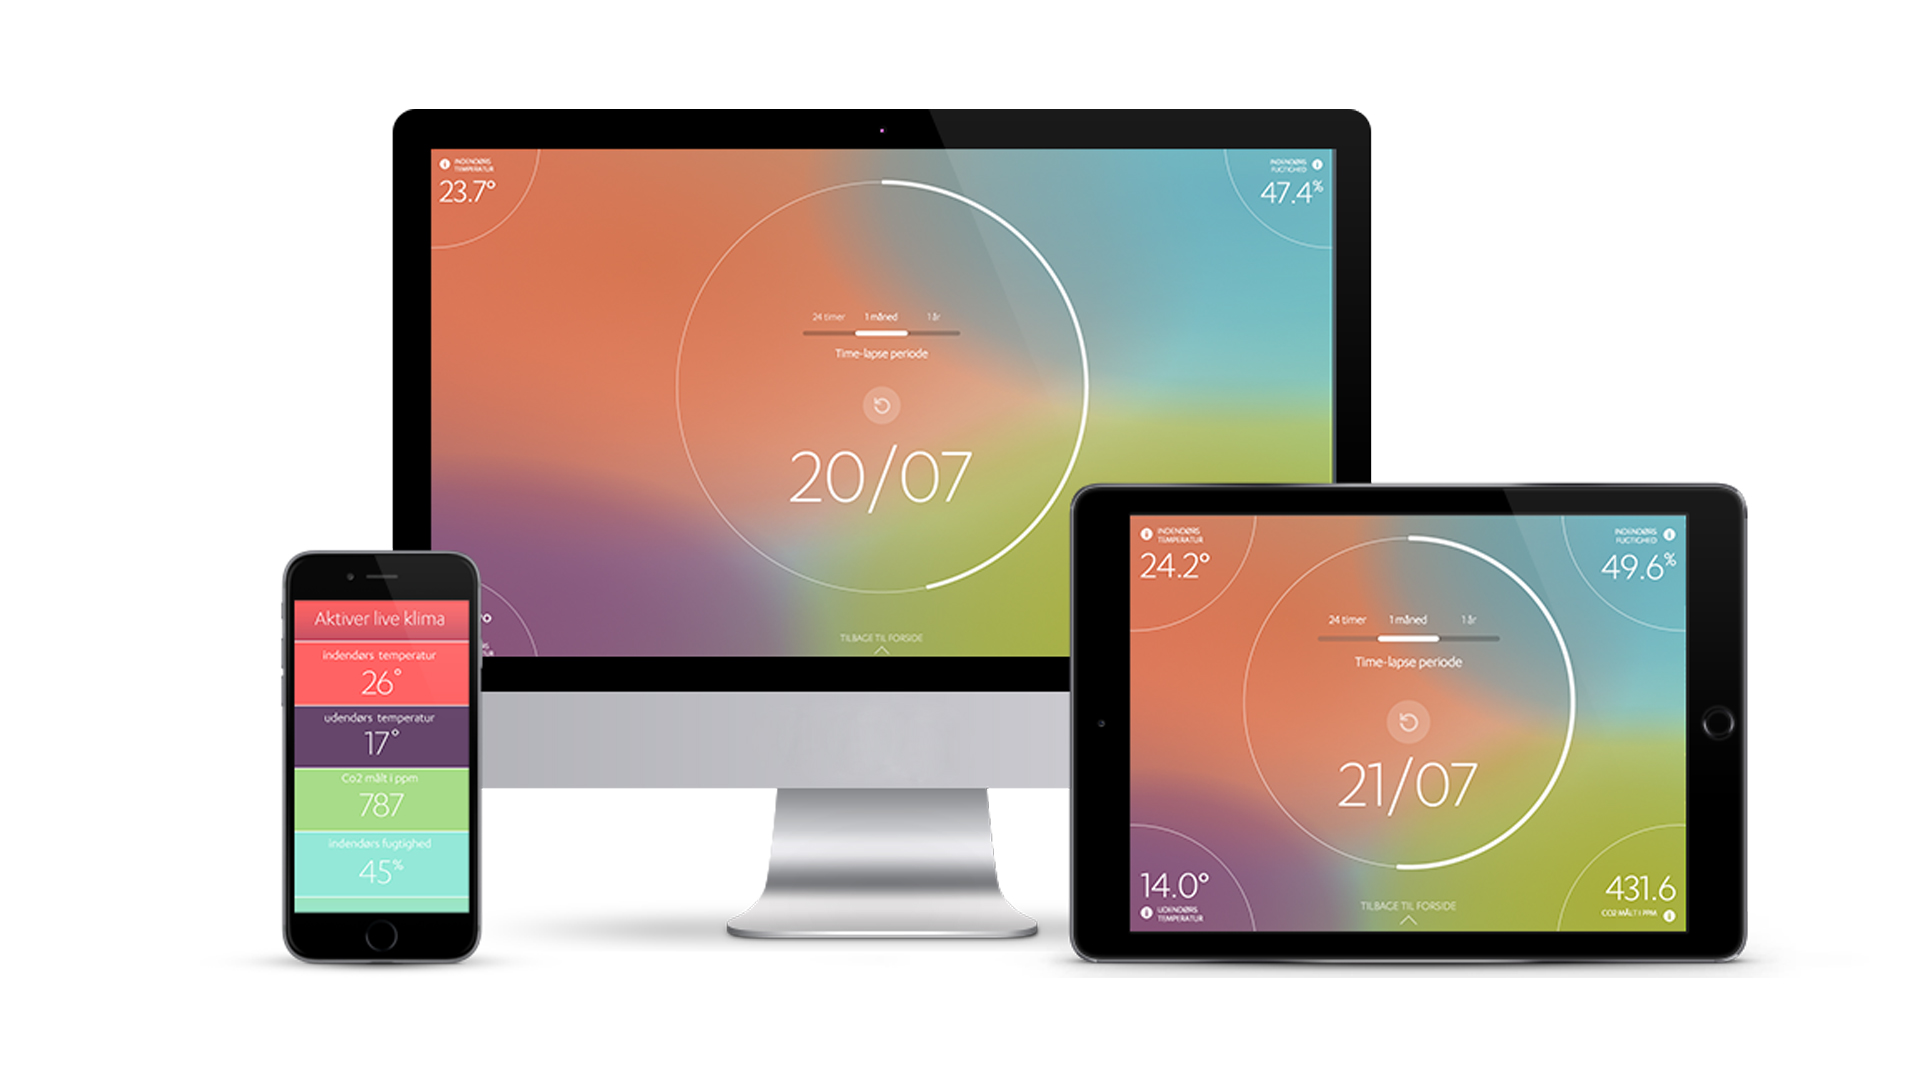
We made a solution within the existing dome of visions website. A top banner takeover was created with a little preview of whats to come. The top banner takeover would lead you to another world inside dome of visions where you get the full visual experience. Data was collected from units installed in the dome in various locations and a heat map was created from these parameters. The heat map is changing in real time - reminding us that WE have an effect on the global warming.